


Statistics by the California Independent System Operator Corp (ISO) show a 24.90% day-on-day increase in wind power output to 79,370 MWh. At 2000 Pacific Daylight Time (PDT) wind hit a peak of 3,677 MW.
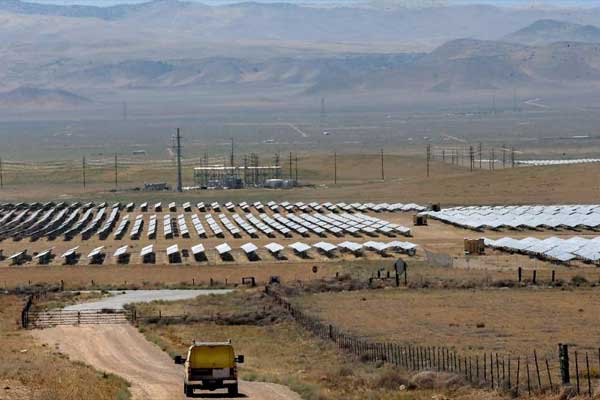
Solar photovoltaic (PV) generation declined to 78,430 MWh from previous day’s 81,505 MWh, peaking at 8,912 MW at 1500 PDT. The solar thermal power output for the day inched down by 8.85% 5,233 MWh.
California also produced a total of 28,804 MWh of geothermal power.
| California’s Renewable Power Generation Structure | |
|---|---|
| RES TYPE | SHARE IN TOTAL RES GENERATION |
| Wind | 37.27% |
| Solar | 36.83% |
| Geothermal | 13.53% |
| Biomass | 4.32% |
| Small hydro | 3.84% |
| Solar thermal | 2.46% |
| Biogas | 1.89% |
Under the California Renewables Portfolio Standard (RPS) plan investor-owned utilities, electric service providers and community choice aggregators in the state have to reach a 33% renewable energy share in total procurement by 2020.


Comments