


China’s carbon emissions have risen this year by an amount that experts say is “globally significant”.
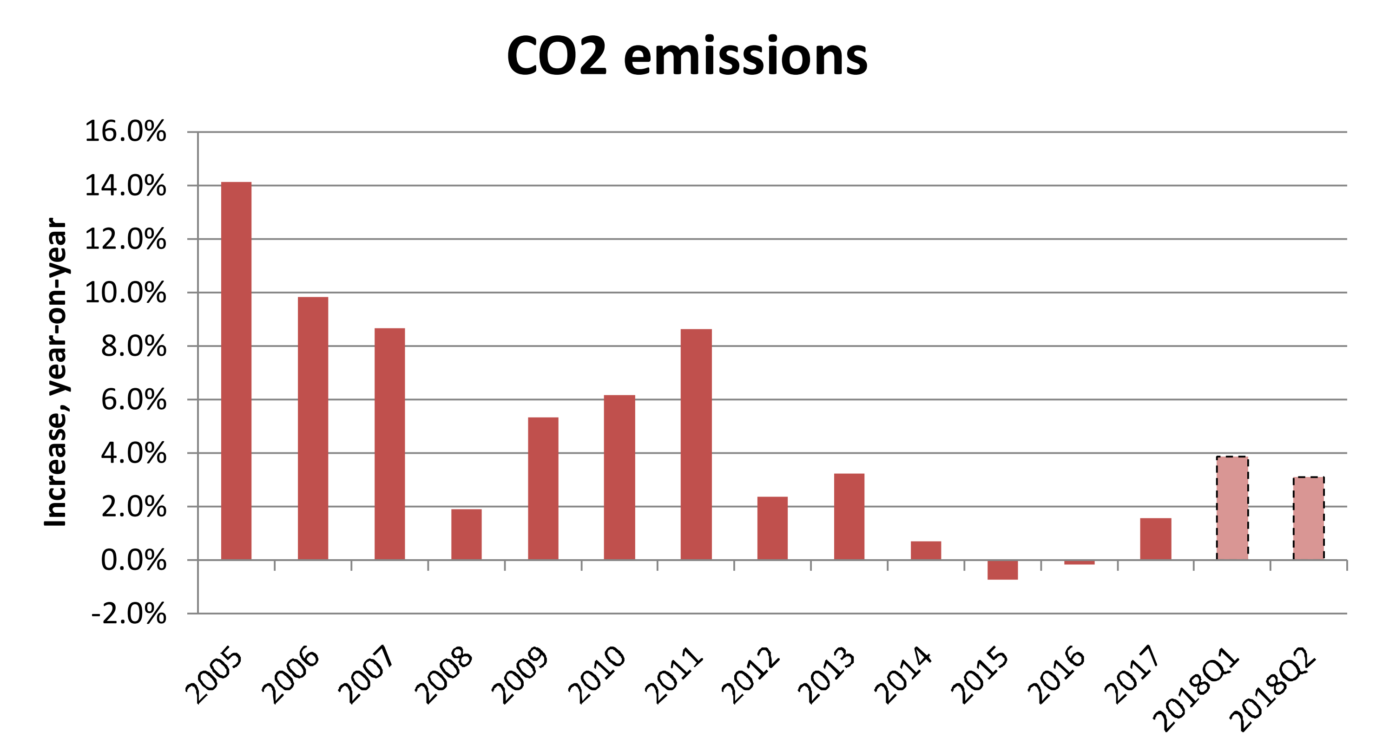
An analysis of official data by Unearthed shows that emissions from the world’s biggest carbon polluter increased 3% in the first half of 2018, compared to the same period last year.
The additional emissions, driven by surging energy demand from industrial growth, are equivalent to those emitted by Spain’s entire energy system.
It follows a 2% rise in 2017, after several years of decline.
The news follows a summer heatwave across the northern hemisphere, with China’s June temperatures the second highest on record.
New research also suggests that China’s northern plain – its most important region for food production and one of the most populous areas in the world – could be hit by the world’s most deadliest heatwaves by the end of the century if emissions are not drastically curbed.
How worried should we be?
It is widely acknowledged that China is on track – or even ahead of its current schedule – to meet its current 2030 emissions reduction target.
But as China is both the world’s biggest emitter and seen as a leader in efforts to combat global climate change, international experts are concerned. However, they are not yet sure if the rise constitutes a long-term trend or is a temporary blip in progress.
Bill Hare, director of German think-tank Climate Analytics, told Unearthed: “The rise is globally significant, and whilst not a trend yet, is a clear warning sign and timely reminder that the deep and urgent action will require sustained efforts and policy attention.
“To meet the Paris agreement long-term temperature goal we should now be in a period where CO2 emissions from coal should be going down globally, and in countries like China stabilizing before an increasingly rapid decline in the next decade. Consequently, a rise like this is of concern.”
The rising emissions could be reversed, especially if the issue of coal consumption is addressed he added.
Neither Hare nor Dr Helena Wright from think-tank E3G thought that the data is yet a sign of China’s role as a global leader on climate change diminishing:
“China is showing political leadership in an absence of leadership from the US. In fact, part of the China rise could be due to temporary stimulus spending to offset the impact of US tariff,” she told Unearthed.
“As the world’s largest emitter, the efforts taken by China on climate change are critical – we should take note of this issue if it becomes a long-lasting trend rather than a temporary rise.”
What’s driving this?
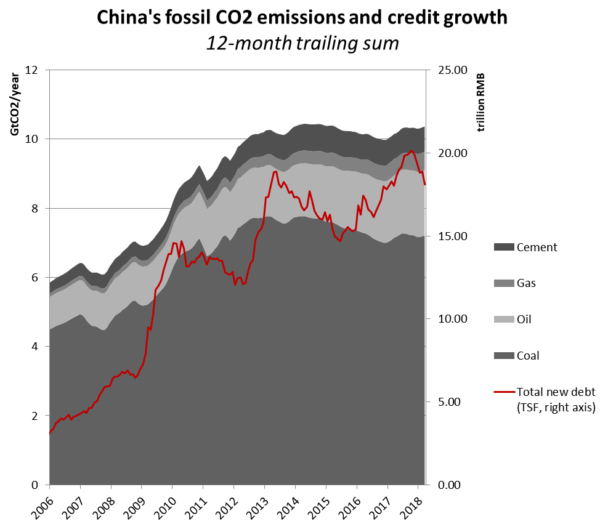
Energy demand is accelerating at its fastest pace since 2011, driven by industrial growth across the economy that follows a record credit boost by China’s banks last year.
The largest increase in industrial power demand came from the iron and steel industries, with China’s steel mills producing record output in recent months. Steel in China is used almost exclusively for construction and for industrial machinery, making up 70-85% of total demand.
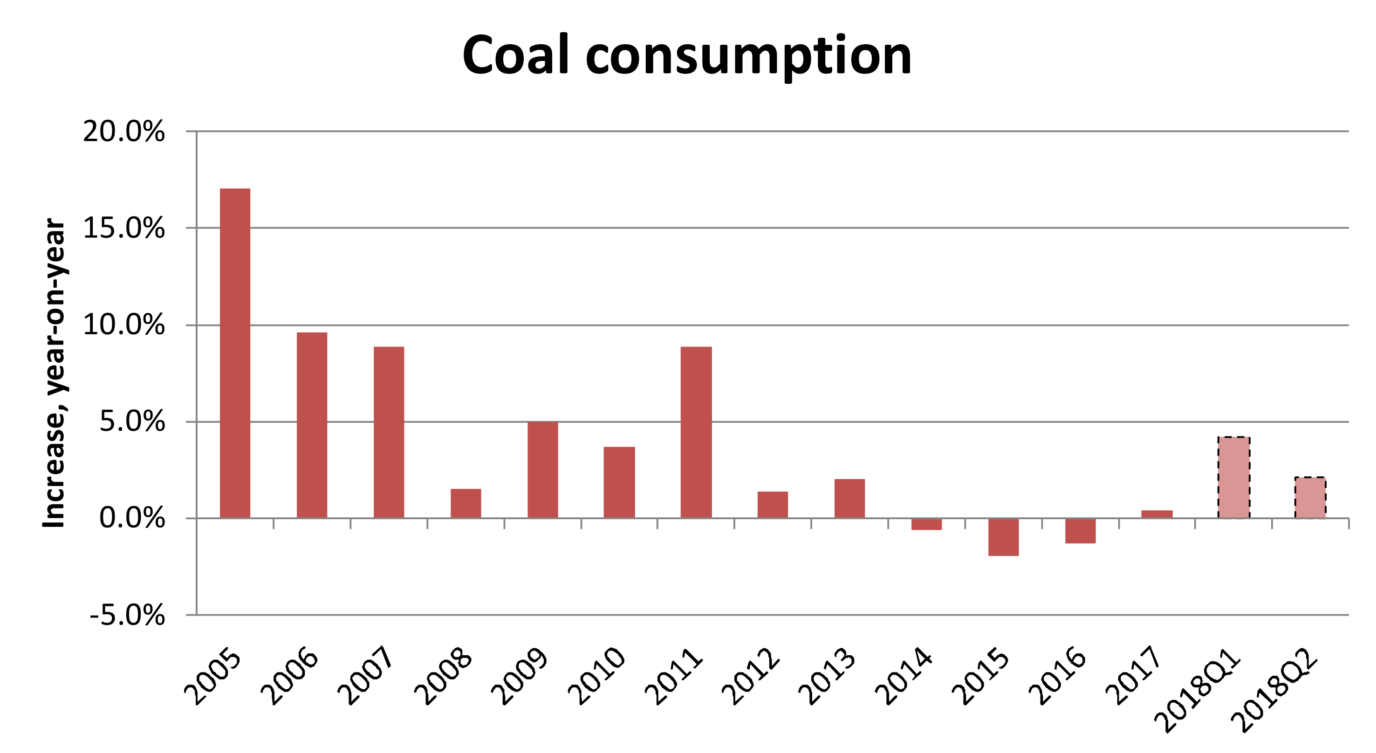
Although renewable energy is still growing, it has been unable to keep up with demand, with coal consumption rising by 3% in the first six months of 2018, after a historic fall that started in 2013.
The weather didn’t help with either, with conditions – lack of rain in some places and far too much in others – meaning that hydropower plants have been producing below capacity, which make up China’s biggest source of renewable power.
The rate of deployment of clean electricity generation would need to double to keep up with growing demand without increasing emissions.
The key drivers of the increase in coal demand are rapid growth in coal-fired power generation and steel output, according to data from WIND Information, the Chinese financial data provider.
The number of new coal power plants that began construction in the second quarter was the highest since the government started clamping down on coal power overcapacity two years ago.
It was also enabled by the loosening of regulations from last year that curbed coal capacity, with a recent analysis of satellite imagery by CoalSwarm identified 46.7GW of previously suspended coal plants that have started or re-entered construction in the last few months.
What next?
Dr Yang Fuqiang, senior energy and climate adviser for the Natural Resources Defense Council China programme predicted that rising energy consumption would slow down in the latter half of the year, but that China would still see an overall emissions rise of 2.6% in 2018.
“We anticipate that the rise of energy consumption, in particular, the coal use, will slow down from July to December. There are a mixture of reasons. The China-US trade war could potentially hit the industrial-energy-intensive energy intensive industries will be contained during the winter heating season; and the hydro-power installation is set to go up.”
China’s increasing energy and coal demand follows a similar rising trend in lending. Data from the People’s Bank of China shows that total new credit grew by 16% in 2016 and 9% in 2017, unleashing a wave of construction that is now driving emissions up.
But new lending slowed by 19% year-on year in the first half of 2018, so if this trend continues, it should trigger a significant slowdown in coal consumption and CO2 emissions growth.
However, the government may be about to loosen its monetary and fiscal policy again, so this is by no means certain.


Comments